Grundlæggende statistik
| Institutionelle ejere | 276 total, 256 long only, 2 short only, 18 long/short - change of 11.900,00% MRQ |
| Gennemsnitlig porteføljeallokering | 0.3438 % - change of -36,30% MRQ |
| Institutionelle aktier (lange) | 131.200.346 (ex 13D/G) - change of 104,59MM shares 49.921,73% MRQ |
| Institutionel værdi (lang) | $ 2.516.263 USD ($1000) |
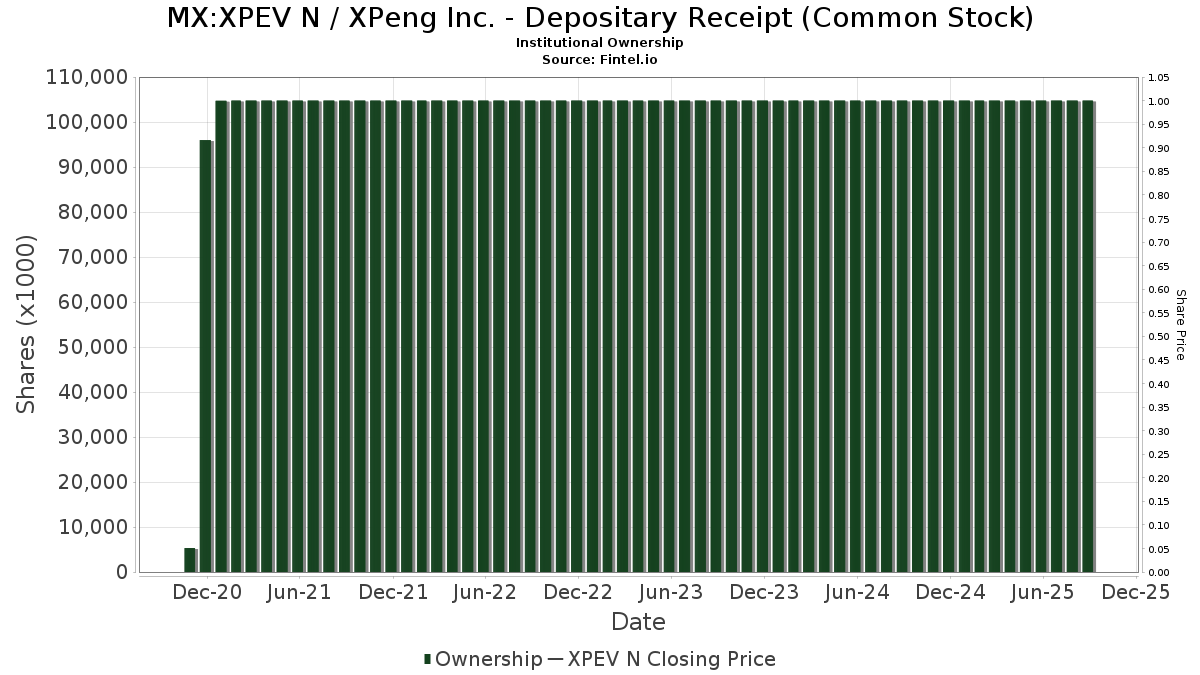
Institutionelt ejerskab og aktionærer
XPeng Inc. - Depositary Receipt (Common Stock) (MX:XPEV N) har 276 institutionelle ejere og aktionærer, der har indsendt 13D/G- eller 13F-formularer til Securities Exchange Commission (SEC). Disse institutioner har i alt 132,931,015 aktier. Største aktionærer omfatter Alibaba Group Holding Ltd, Primecap Management Co/ca/, TMT General Partner Ltd, VHCOX - Vanguard Capital Opportunity Fund Investor Shares, Ghisallo Capital Management LLC, Morgan Stanley, UBS Group AG, Susquehanna International Group, Llp, Primavera Capital Management Ltd, and Goldman Sachs Group Inc .
XPeng Inc. - Depositary Receipt (Common Stock) (BMV:XPEV N) institutionel ejerskabsstruktur viser aktuelle positioner i virksomheden efter institutioner og fonde, samt seneste ændringer i positionsstørrelse. Større aktionærer kan omfatte individuelle investorer, investeringsforeninger, hedgefonde eller institutioner. Skema 13D angiver, at investoren besidder (eller besidder) mere end 5 % af virksomheden og har til hensigt (eller har til hensigt at) aktivt at forfølge en ændring i forretningsstrategi. Skema 13G indikerer en passiv investering på over 5%.
Fondens stemningsscore
Fund Sentiment Score (fka Ownership Accumulation Score) finder de aktier, der bliver mest købt af fonde. Det er resultatet af en sofistikeret, multi-faktor kvantitativ model, der identificerer virksomheder med de højeste niveauer af institutionel akkumulering. Scoringsmodellen bruger en kombination af den samlede stigning i oplyste ejere, ændringerne i porteføljeallokeringer i disse ejere og andre målinger. Tallet går fra 0 til 100, hvor højere tal indikerer et højere niveau af akkumulering for sine jævnaldrende, og 50 er gennemsnittet.
Opdateringsfrekvens: Dagligt
Se Ownership Explorer, som giver en liste over højest rangerende virksomheder.
AI+ Ask Fintel’s AI assistant about XPeng Inc. - Depositary Receipt (Common Stock).
Select a question to share a public post with an AI-crafted answer.
Thinking of good questions…
13F og NPORT arkivering
Detaljer om 13F-arkivering er gratis. Detaljer om NP-ansøgninger kræver et premium-medlemskab. Grønne rækker angiver nye positioner. Røde rækker angiver lukkede positioner. Klik på linket ikon for at se den fulde transaktionshistorik.
Opgrader
for at låse premium-data op og eksportere til Excel ![]() .
.
| Fil dato | Kilde | Investor | Type | Gennemsnitlig pris (Øst) |
Aktier | Δ Aktier (%) |
Rapporteret Værdi ($1000) |
Δ Værdi (%) |
Port Alloc (%) |
|
|---|---|---|---|---|---|---|---|---|---|---|
| 2026-02-17 | 13F | LMR Partners LLP | Call | 385.000 | 0,00 | 7.808 | -13,41 | |||
| 2026-02-17 | 13F | LMR Partners LLP | 100.000 | 2.028 | ||||||
| 2026-02-06 | 13F | Bare Financial Services, Inc | 101 | 2 | ||||||
| 2026-02-17 | 13F | LMR Partners LLP | Put | 385.000 | 0,00 | 7.808 | -13,41 | |||
| 2025-11-14 | 13F | XTX Topco Ltd | 0 | -100,00 | 0 | -100,00 | ||||
| 2026-01-02 | 13F | Global Wealth Strategies & Associates | 11 | 0 | ||||||
| 2026-02-17 | 13F | Raymond James Financial Inc | 18.992 | -31,74 | 385 | -40,86 | ||||
| 2025-11-14 | 13F | Lazard Asset Management Llc | 0 | -100,00 | 0 | |||||
| 2026-02-17 | 13F | Dv Equities, Llc | 23 | 0 | ||||||
| 2026-01-16 | 13F | Compagnie Lombard Odier SCmA | 450 | 0,00 | 9 | -10,00 | ||||
| 2026-02-17 | 13F | Two Sigma Advisers, Lp | 18.600 | -91,60 | 377 | -92,73 | ||||
| 2026-02-06 | 13F | Pnc Financial Services Group, Inc. | 18.571 | 0,09 | 377 | -13,36 | ||||
| 2025-09-25 | NP | DFEM - Dimensional Emerging Markets Core Equity 2 ETF | 3.000 | 0,00 | 55 | -1,82 | ||||
| 2026-02-06 | 13F | Profund Advisors Llc | 92.744 | -20,23 | 1.881 | -30,96 | ||||
| 2026-02-03 | 13F | Winch Advisory Services, LLC | 28 | 0,00 | 1 | |||||
| 2026-02-13 | 13F | Wexford Capital Lp | 34.614 | 5,50 | 702 | -8,72 | ||||
| 2025-08-28 | NP | Roundhill ETF Trust - Roundhill Humanoid Robotics ETF | 7.997 | 143 | ||||||
| 2026-01-08 | 13F | True Wealth Design, LLC | 21 | -73,75 | 0 | -100,00 | ||||
| 2026-01-28 | 13F | CAPROCK Group, Inc. | 15.037 | 305 | ||||||
| 2026-02-19 | 13F | Invesco Ltd. | 1.278.673 | 114,53 | 25.931 | 85,77 | ||||
| 2026-02-17 | 13F | Massar Capital Management, LP | 38.300 | 0,00 | 777 | -13,39 | ||||
| 2026-02-13 | 13F | Pinnacle Wealth Planning Services, Inc. | 4.705 | 95 | ||||||
| 2026-01-21 | 13F | Flagship Harbor Advisors, Llc | 100 | 2 | ||||||
| 2026-01-22 | 13F | Venturi Wealth Management, LLC | 9.910 | -6,71 | 201 | -19,35 | ||||
| 2026-01-09 | 13F | 180 Wealth Advisors, Llc | 0 | -100,00 | 0 | |||||
| 2025-11-14 | 13F | Point72 Europe (London) LLP | 107.493 | 71,44 | 2.517 | 124,53 | ||||
| 2025-10-07 | 13F | Quintet Private Bank (Europe) S.A. | 0 | -100,00 | 0 | |||||
| 2025-10-30 | 13F | Investment Management Corp /va/ /adv | 0 | -100,00 | 0 | |||||
| 2026-02-17 | 13F | Point72 Asset Management, L.P. | 160.378 | 3.252 | ||||||
| 2026-02-17 | 13F | Point72 Asset Management, L.P. | Put | 100.600 | 0,00 | 2.040 | -13,41 | |||
| 2026-02-17 | 13F | Point72 Asset Management, L.P. | Call | 93.500 | 36,30 | 1.896 | 18,06 | |||
| 2025-10-28 | 13F | Nations Financial Group Inc, /ia/ /adv | 0 | -100,00 | 0 | |||||
| 2026-02-02 | 13F | Triasima Portfolio Management inc. | 124.865 | -46,13 | 2.532 | -53,35 | ||||
| 2025-11-14 | 13F | Bayesian Capital Management, LP | 0 | -100,00 | 0 | |||||
| 2026-01-27 | 13F | TD Waterhouse Canada Inc. | 3.080 | 0,00 | 62 | -15,07 | ||||
| 2026-02-13 | 13F | Pathstone Holdings, LLC | 30.679 | -20,86 | 622 | -31,42 | ||||
| 2026-02-17 | 13F | Trexquant Investment LP | 0 | -100,00 | 0 | |||||
| 2025-08-25 | 13F/A | Neuberger Berman Group LLC | 0 | -100,00 | 0 | -100,00 | ||||
| 2025-11-12 | 13F | HAP Trading, LLC | Call | 22.200 | 54 | |||||
| 2025-11-12 | 13F | HAP Trading, LLC | Put | 11.300 | 2 | |||||
| 2026-01-21 | 13F | Stone House Investment Management, LLC | 18 | -80,22 | 0 | -100,00 | ||||
| 2026-02-02 | 13F | CENTRAL TRUST Co | 1.000 | 20 | ||||||
| 2025-10-08 | 13F/A | New York State Common Retirement Fund | 0 | -100,00 | 0 | |||||
| 2026-02-17 | 13F | Qube Research & Technologies Ltd | Put | 15.200 | 15.100,00 | 308 | 15.300,00 | |||
| 2026-02-17 | 13F | Qube Research & Technologies Ltd | Call | 103.500 | 4.040,00 | 2.099 | 3.517,24 | |||
| 2026-02-13 | 13F | Morgan Stanley | 5.855.148 | 14,98 | 118.742 | -0,44 | ||||
| 2026-02-03 | 13F | Sequoia Financial Advisors, LLC | 18.036 | -0,84 | 366 | -14,12 | ||||
| 2026-01-09 | 13F | SG Americas Securities, LLC | 1.168.406 | 7,10 | 24 | -8,00 | ||||
| 2026-02-18 | 13F | Mackenzie Financial Corp | 144.928 | 1,88 | 3.078 | -7,60 | ||||
| 2026-02-17 | 13F | Caption Management, LLC | 0 | -100,00 | 0 | |||||
| 2025-08-27 | NP | RYWTX - Emerging Markets 2x Strategy Fund Class A | 3.514 | 148,34 | 63 | 113,79 | ||||
| 2026-01-27 | 13F | Zurcher Kantonalbank (Zurich Cantonalbank) | 11.627 | 73,38 | 236 | 49,68 | ||||
| 2026-02-17 | 13F | Advisor Group Holdings, Inc. | 4.688 | 1,38 | 95 | -7,77 | ||||
| 2026-02-13 | 13F | Macquarie Group Ltd | 20.287 | -50,00 | 411 | -50,90 | ||||
| 2026-02-06 | 13F | IFP Advisors, Inc | 271 | 281,69 | 5 | 400,00 | ||||
| 2026-02-17 | 13F | Royal Bank Of Canada | 13.060 | -15,23 | 264 | -26,67 | ||||
| 2025-11-14 | 13F | J. Goldman & Co LP | 0 | -100,00 | 0 | |||||
| 2026-01-23 | 13F | Bridgewater Advisors Inc. | 9.868 | 4,31 | 201 | -11,11 | ||||
| 2026-02-12 | 13F | Steward Partners Investment Advisory, Llc | 830 | -1,78 | 17 | -15,79 | ||||
| 2026-02-17 | 13F | Susquehanna International Group, Llp | 2.201.547 | -11,33 | 44.647 | -23,22 | ||||
| 2026-02-13 | 13F | Knollwood Investment Advisory, LLC | 11.250 | -21,60 | 228 | -32,14 | ||||
| 2026-02-12 | 13F | CMT Capital Markets Trading GmbH | 2.505 | -87,22 | 0 | |||||
| 2026-02-03 | 13F | SBI Securities Co., Ltd. | 16.535 | 7,73 | 335 | -6,69 | ||||
| 2026-02-17 | 13F | Susquehanna International Group, Llp | Put | 2.486.900 | -39,98 | 50.434 | -48,03 | |||
| 2026-02-17 | 13F | Susquehanna International Group, Llp | Call | 4.988.000 | -11,52 | 101.157 | -23,38 | |||
| 2026-01-14 | 13F | Exchange Traded Concepts, Llc | 1.030.947 | 39,52 | 20.908 | 20,81 | ||||
| 2026-02-06 | 13F | Global Retirement Partners, LLC | 487 | 161,83 | 10 | 125,00 | ||||
| 2025-09-26 | NP | PBD - Invesco Global Clean Energy ETF This fund is a listed as child fund of Invesco Ltd. and if that institution has disclosed ownership in this security, then these positions will not be double counted when calculating total shares and total value | 30.532 | -23,28 | 556 | -25,00 | ||||
| 2026-02-12 | 13F | Marex Group plc | 18.217 | 369 | ||||||
| 2026-02-13 | 13F | Gts Securities Llc | 0 | -100,00 | 0 | |||||
| 2026-02-04 | 13F | Tsfg, Llc | 100 | 0,00 | 0 | |||||
| 2026-02-06 | 13F | HighTower Advisors, LLC | 17.089 | 0,84 | 347 | -12,63 | ||||
| 2026-02-13 | 13F | Cornerstone Financial Management LLC | 41 | 1 | ||||||
| 2025-08-26 | NP | Forethought Variable Insurance Trust - Global Atlantic BlackRock Disciplined Core Portfolio Class I Shares | 4.284 | 0,00 | 77 | -13,64 | ||||
| 2025-11-12 | 13F/A | Norges Bank | 1.438.159 | 17.517 | ||||||
| 2026-02-13 | 13F | PCM Encore, LLC | 23.346 | 473 | ||||||
| 2026-02-11 | 13F | Deutsche Bank Ag\ | 80.883 | -0,15 | 1.640 | -13,55 | ||||
| 2026-02-05 | 13F | Central Asset Investments & Management Holdings (HK) Ltd | 38.222 | -89,05 | 775 | -90,52 | ||||
| 2026-02-10 | 13F | Strategic Advisors LLC | 44.492 | -2,62 | 902 | -15,70 | ||||
| 2025-12-15 | 13F | FNY Investment Advisers, LLC | 0 | -100,00 | 0 | |||||
| 2025-08-26 | NP | NXTE - AXS Green Alpha ETF | 29.794 | 0,00 | 533 | -13,78 | ||||
| 2026-01-23 | 13F | Robeco Institutional Asset Management B.V. | 18.536 | 376 | ||||||
| 2025-10-23 | 13F | Spire Wealth Management | 0 | -100,00 | 0 | |||||
| 2026-02-12 | 13F | Renaissance Technologies Llc | 0 | -100,00 | 0 | |||||
| 2025-11-13 | 13F | Jump Financial, LLC | 0 | -100,00 | 0 | |||||
| 2025-09-24 | NP | SNTKX - Steward International Enhanced Index Fund Class A | 9.078 | 0,00 | 165 | -1,79 | ||||
| 2026-02-24 | 13F | Bell Investment Advisors, Inc | 609 | 85,11 | 12 | 71,43 | ||||
| 2025-11-14 | 13F | Wolverine Trading, Llc | 55.470 | 25,51 | 1.286 | 60,55 | ||||
| 2025-11-14 | 13F | Wolverine Trading, Llc | Call | 427.100 | 119,25 | 9.904 | 180,49 | |||
| 2026-02-10 | 13F | Main Management ETF Advisors, LLC | 115.101 | 1,03 | 2 | 0,00 | ||||
| 2025-11-14 | 13F | Wolverine Trading, Llc | Put | 254.000 | 57,37 | 5.890 | 101,30 | |||
| 2026-02-17 | 13F | Bamco Inc /ny/ | 940.642 | 1,28 | 19.076 | -12,30 | ||||
| 2026-02-11 | 13F | Curio Wealth, Llc | 15 | 0 | ||||||
| 2026-02-11 | 13F | Simplex Trading, Llc | 447.752 | 99,03 | 9.080 | 181.500,00 | ||||
| 2026-02-12 | 13F | Rossby Financial, LCC | 50 | 0,00 | 1 | 0,00 | ||||
| 2025-08-28 | NP | HAIL - SPDR S&P Kensho Smart Mobility ETF This fund is a listed as child fund of State Street Corp and if that institution has disclosed ownership in this security, then these positions will not be double counted when calculating total shares and total value | 15.653 | -45,74 | 280 | -53,27 | ||||
| 2026-01-26 | 13F | Cwm, Llc | 3.318 | 20,48 | 0 | |||||
| 2026-02-02 | 13F | Fifth Third Bancorp | 1.023 | 21 | ||||||
| 2026-02-17 | 13F | Tudor Investment Corp Et Al | Call | 24.600 | 499 | |||||
| 2026-02-17 | 13F | Tudor Investment Corp Et Al | Put | 10.000 | 203 | |||||
| 2025-08-28 | NP | SPGM - SPDR(R) Portfolio MSCI Global Stock Market ETF | 60 | 0,00 | 1 | 0,00 | ||||
| 2026-01-29 | 13F | Sanctuary Advisors, LLC | 12.824 | -2,52 | 260 | -15,58 | ||||
| 2026-02-17 | 13F | Cetera Investment Advisers | 0 | -100,00 | 0 | |||||
| 2026-01-26 | 13F | Mirae Asset Global Investments Co., Ltd. | 53.570 | -1,22 | 1.086 | -14,49 | ||||
| 2026-01-20 | 13F | Signaturefd, Llc | 23.051 | -2,95 | 467 | -16,01 | ||||
| 2025-09-29 | NP | TRFM - AAM Transformers ETF | 15.115 | 141,96 | 275 | 137,07 | ||||
| 2026-02-11 | 13F | Group One Trading, L.p. | 42.457 | 861 | ||||||
| 2026-02-13 | 13F | MAI Capital Management | 658 | 65,33 | 13 | 44,44 | ||||
| 2026-02-12 | 13F | Principal Securities, Inc. | 0 | -100,00 | 0 | |||||
| 2025-11-14 | 13F | Caption Management, LLC | Put | 0 | -100,00 | 0 | -100,00 | |||
| 2025-09-25 | NP | DFSE - Dimensional Emerging Markets Sustainability Core 1 ETF | 50 | 0,00 | 1 | -100,00 | ||||
| 2026-02-05 | 13F | Navalign, LLC | 40 | 1 | ||||||
| 2026-01-29 | 13F | Rakuten Securities, Inc. | 18.595 | 190,50 | 377 | 153,02 | ||||
| 2026-02-13 | 13F | National Bank Of Canada /fi/ | 4.240 | -2,24 | 86 | -15,84 | ||||
| 2026-02-12 | 13F | Groupe la Francaise | 0 | -100,00 | 0 | |||||
| 2025-08-29 | NP | NTSE - WisdomTree Emerging Markets Efficient Core Fund N/A | 611 | 0,00 | 11 | -16,67 | ||||
| 2026-02-06 | 13F | Larson Financial Group LLC | 91 | -54,27 | 2 | -75,00 | ||||
| 2026-02-17 | 13F | Ghisallo Capital Management LLC | 7.500.000 | 1.400,00 | 152.100 | 1.198,89 | ||||
| 2026-02-13 | 13F | Walleye Trading LLC | 359.175 | 7.284 | ||||||
| 2025-08-28 | NP | BATT - Amplify Advanced Battery Metals and Materials ETF | 42.155 | -19,17 | 754 | -30,28 | ||||
| 2026-02-13 | 13F | Walleye Trading LLC | Put | 826.200 | -22,23 | 16.755 | -32,65 | |||
| 2026-02-13 | 13F | Walleye Trading LLC | Call | 1.235.400 | 66,25 | 25.054 | 43,96 | |||
| 2025-11-14 | 13F | Bridgefront Capital, LLC | 0 | -100,00 | 0 | -100,00 | ||||
| 2026-02-13 | 13F | Vontobel Holding Ltd. | 46.484 | 140,61 | 943 | 108,41 | ||||
| 2025-11-14 | 13F | Truvestments Capital Llc | 0 | -100,00 | 0 | |||||
| 2026-02-13 | 13F | Walleye Capital LLC | Put | 147.100 | 735,80 | 2.983 | 624,03 | |||
| 2025-09-29 | NP | TMAT - Main Thematic Innovation ETF | 109.368 | 1.992 | ||||||
| 2026-02-13 | 13F | Walleye Capital LLC | 118.162 | 2.468,74 | 2.396 | 2.139,25 | ||||
| 2026-02-13 | 13F | Polymer Capital Management (HK) LTD | 27.700 | 73,91 | 562 | 50,40 | ||||
| 2025-09-26 | NP | ROBO - ROBO Global(R) Robotics and Automation Index ETF | 576.027 | 10.489 | ||||||
| 2026-02-13 | 13F | Walleye Capital LLC | Call | 110.900 | 1.845,61 | 2.249 | 1.590,98 | |||
| 2026-02-05 | 13F | LGT Fund Management Co Ltd. | 0 | -100,00 | 0 | |||||
| 2025-11-13 | 13F | Connor, Clark & Lunn Investment Management Ltd. | 0 | -100,00 | 0 | -100,00 | ||||
| 2025-11-14 | 13F | Arrowpoint Investment Partners (Singapore) Pte. Ltd. | Call | 0 | -100,00 | 0 | -100,00 | |||
| 2026-01-21 | 13F | Greenleaf Trust | 17.057 | 0,31 | 346 | -13,32 | ||||
| 2025-08-26 | NP | FTHI - First Trust BuyWrite Income ETF This fund is a listed as child fund of First Trust Advisors Lp and if that institution has disclosed ownership in this security, then these positions will not be double counted when calculating total shares and total value | 60.101 | -3,30 | 1.075 | -16,55 | ||||
| 2026-02-12 | 13F | DRW Securities, LLC | 0 | -100,00 | 0 | |||||
| 2026-02-13 | 13F | SRS Capital Advisors, Inc. | 335 | 80,11 | 7 | 50,00 | ||||
| 2025-11-13 | 13F | Russell Investments Group, Ltd. | 0 | -100,00 | 0 | -100,00 | ||||
| 2026-02-13 | 13F | Becker Capital Management Inc | 22.000 | 446 | ||||||
| 2026-02-13 | 13F | Verition Fund Management LLC | Put | 23.600 | 479 | |||||
| 2025-11-14 | 13F | Polymer Capital Management (US) LLC | 0 | -100,00 | 0 | -100,00 | ||||
| 2026-02-13 | 13F | Rhumbline Advisers | 3.974 | -8,92 | 81 | -21,57 | ||||
| 2025-10-30 | 13F | Mizuho Securities Co. Ltd. | 0 | -100,00 | 0 | -100,00 | ||||
| 2026-02-10 | 13F/A | Northwestern Mutual Wealth Management Co | 791 | -0,25 | 16 | -11,11 | ||||
| 2026-02-11 | 13F | Havemeyer Place LP | 76.108 | 1.543 | ||||||
| 2026-02-12 | 13F | Jane Street Group, Llc | 0 | -100,00 | 0 | -100,00 | ||||
| 2026-02-18 | 13F | Vident Advisory, LLC | 55.997 | 0,40 | 1.136 | -13,09 | ||||
| 2026-02-17 | 13F | Ameriprise Financial Inc | 24.621 | -5,61 | 499 | -18,20 | ||||
| 2026-02-17 | 13F | Laird Norton Trust Company, Llc | 81.855 | 1.660 | ||||||
| 2025-11-14 | 13F | Sig Brokerage, Lp | Call | 0 | -100,00 | 0 | ||||
| 2026-02-09 | 13F | Key FInancial Inc | 74 | 0,00 | 2 | 0,00 | ||||
| 2026-02-13 | 13F | Dymon Asia Capital (singapore) Pte. Ltd. | 0 | -100,00 | 0 | |||||
| 2026-02-02 | 13F | Nkcfo Llc | 18.000 | 80,00 | 0 | |||||
| 2026-02-17 | 13F | Orland Properties Ltd | 774.462 | 0,00 | 15.706 | -13,40 | ||||
| 2026-02-03 | 13F | Ethic Inc. | 78.380 | 6,08 | 1.590 | -8,15 | ||||
| 2026-01-23 | 13F | Farther Finance Advisors, LLC | 2.562 | 161,43 | 52 | 131,82 | ||||
| 2026-02-17 | 13F | Jain Global LLC | 65.492 | 1.328 | ||||||
| 2026-02-12 | 13F | Quadrant Capital Group Llc | 20.250 | -1,46 | 411 | -14,76 | ||||
| 2026-02-05 | 13F | Phoenix Holdings Ltd. | 0 | -100,00 | 0 | |||||
| 2026-02-12 | 13F | Alibaba Group Holding Ltd | 33.537.232 | 0,00 | 680.135 | -13,41 | ||||
| 2026-02-13 | 13F | Natixis | 7.964 | -62,50 | 162 | -67,61 | ||||
| 2026-02-17 | 13F | Engineers Gate Manager LP | 31.329 | 22,39 | 635 | 6,01 | ||||
| 2026-02-17 | 13F | Credit Agricole S A | 10.569 | 214 | ||||||
| 2026-02-17 | 13F | Millennium Management Llc | 49.468 | -90,44 | 1.003 | -91,72 | ||||
| 2026-02-17 | 13F | Fmr Llc | 81.203 | -32,82 | 1.647 | -41,86 | ||||
| 2026-01-21 | 13F | Aaron Wealth Advisors LLC | 0 | -100,00 | 0 | |||||
| 2026-02-17 | 13F | Millennium Management Llc | Call | 104.600 | 1.012,77 | 2.121 | 864,09 | |||
| 2026-02-17 | 13F | Millennium Management Llc | Put | 118.100 | -44,99 | 2.395 | -52,37 | |||
| 2026-01-08 | 13F | Tuttle Tactical Management LLC | 13.176 | 267 | ||||||
| 2026-02-11 | 13F | Vise Technologies, Inc. | 27.645 | -1,23 | 561 | -14,50 | ||||
| 2026-02-05 | 13F | Bessemer Group Inc | 10 | 0,00 | 0 | |||||
| 2026-02-05 | 13F | Abacus Wealth Partners, LLC | 52.272 | 1.060 | ||||||
| 2026-02-02 | 13F | Truist Financial Corp | 14.285 | -13,86 | 290 | -25,52 | ||||
| 2026-02-13 | 13F | JustInvest LLC | 73.805 | 6,91 | 1.497 | -7,43 | ||||
| 2026-02-03 | 13F | Washington Trust Advisors, Inc. | 150 | 0,00 | 3 | 0,00 | ||||
| 2025-08-29 | NP | MPLAX - Praxis International Index Fund Class A | 27.625 | 0,00 | 494 | -13,81 | ||||
| 2026-02-17 | 13F | Himension Fund | 0 | -100,00 | 0 | |||||
| 2026-02-17 | 13F | Qube Research & Technologies Ltd | 0 | -100,00 | 0 | |||||
| 2025-11-07 | 13F | Shell Asset Management Co | 0 | -100,00 | 0 | |||||
| 2026-01-29 | 13F | UBS Group AG | Put | 299.900 | 6.082 | |||||
| 2026-01-29 | 13F | UBS Group AG | Call | 2.757.716 | 4,63 | 55.926 | -9,40 | |||
| 2026-01-29 | 13F | UBS Group AG | 5.341.214 | -48,20 | 108.320 | -55,15 | ||||
| 2025-08-26 | NP | EHLS - Even Herd Long Short ETF | 0 | -100,00 | 0 | -100,00 | ||||
| 2026-02-13 | 13F | Barclays Plc | 1.060.869 | 382,22 | 21.514 | 317,59 | ||||
| 2026-02-10 | 13F | Yunqi Capital Ltd | 212.600 | 4.312 | ||||||
| 2026-02-13 | 13F | Barclays Plc | Call | 381.300 | 281,30 | 7.733 | 230,15 | |||
| 2026-02-17 | 13F | Schonfeld Strategic Advisors LLC | 0 | -100,00 | 0 | |||||
| 2026-02-10 | 13F | JTC Employer Solutions Trusteee Ltd | 1.271 | 0,00 | 0 | |||||
| 2025-10-30 | 13F | Ridgewood Investments LLC | 0 | -100,00 | 0 | -100,00 | ||||
| 2026-02-03 | 13F | Mitsubishi UFJ Kokusai Asset Management Co., Ltd. | 88.688 | -19,19 | 1.812 | -29,53 | ||||
| 2026-02-06 | 13F/A | Rathbone Brothers plc | 24.858 | 1,26 | 504 | -12,20 | ||||
| 2026-01-26 | 13F | PDS Planning, Inc | 11.779 | -1,22 | 239 | -14,70 | ||||
| 2026-01-22 | 13F | Maseco Llp | 299 | 0,00 | 6 | -14,29 | ||||
| 2025-11-03 | 13F | Private Wealth Asset Management, LLC | 0 | -100,00 | 0 | -100,00 | ||||
| 2026-02-13 | 13F | Motiv8 Investments LLC | 3 | 0 | ||||||
| 2026-02-09 | 13F | Legal & General Group Plc | 692.554 | 30,09 | 14.046 | 12,65 | ||||
| 2026-02-13 | 13F | Caitong International Asset Management Co., Ltd | 2.708 | 159,14 | 55 | 125,00 | ||||
| 2026-02-13 | 13F | Barclays Plc | Put | 0 | -100,00 | 0 | -100,00 | |||
| 2026-02-13 | 13F | First Trust Advisors Lp | 0 | -100,00 | 0 | |||||
| 2026-02-17 | 13F | Advisory Services Network, LLC | 0 | -100,00 | 0 | |||||
| 2025-11-14 | 13F | Cetera Investment Advisers | Put | 0 | -100,00 | 0 | -100,00 | |||
| 2025-08-27 | NP | VHCOX - Vanguard Capital Opportunity Fund Investor Shares | 9.075.419 | 2,14 | 162.268 | -11,86 | ||||
| 2025-11-14 | 13F | ExodusPoint Capital Management, LP | 0 | -100,00 | 0 | |||||
| 2026-01-22 | 13F | Financial Consulate, Inc | 28 | 1 | ||||||
| 2025-08-28 | NP | CWI - SPDR(R) MSCI ACWI EX-US ETF | 19.329 | 0,35 | 346 | -13,53 | ||||
| 2026-02-17 | 13F | DZ BANK AG Deutsche Zentral Genossenschafts Bank, Frankfurt am Main | 8.000 | 162 | ||||||
| 2026-01-20 | 13F | AdvisorNet Financial, Inc | 355 | -48,18 | 7 | -56,25 | ||||
| 2026-02-13 | 13F | Ubs Asset Management Americas Inc | 190 | 4 | ||||||
| 2026-02-13 | 13F | Y-Intercept (Hong Kong) Ltd | 0 | -100,00 | 0 | |||||
| 2026-01-27 | 13F | Gf Fund Management Co. Ltd. | 2.088 | -99,56 | 42 | -99,63 | ||||
| 2026-02-06 | 13F | EverSource Wealth Advisors, LLC | 3.906 | 44,99 | 79 | 25,40 | ||||
| 2026-02-13 | 13F | American Century Companies Inc | 32.679 | 2,17 | 663 | -11,62 | ||||
| 2026-01-30 | 13F | Ares Financial Consulting, LLC | 73 | 1 | ||||||
| 2026-02-17 | 13F | Two Sigma Securities, Llc | 0 | -100,00 | 0 | |||||
| 2026-02-17 | 13F | SIH Partners, LLLP | 2.226.625 | 799,23 | 45.156 | 678,67 | ||||
| 2025-10-07 | 13F | St Germain D J Co Inc | 0 | -100,00 | 0 | |||||
| 2026-02-13 | 13F | Van Eck Associates Corp | 149.575 | -16,55 | 3 | -25,00 | ||||
| 2026-02-13 | 13F | Golden State Wealth Management, LLC | 250 | 0,00 | 5 | 0,00 | ||||
| 2026-02-03 | 13F | Ballentine Partners, LLC | 25.342 | 1,44 | 514 | -12,31 | ||||
| 2026-01-13 | 13F | Global X Japan Co., Ltd. | 0 | -100,00 | 0 | |||||
| 2026-02-13 | 13F | Headlands Technologies LLC | 122.037 | 319,92 | 2.475 | 263,82 | ||||
| 2025-09-26 | NP | PGJ - Invesco Golden Dragon China ETF This fund is a listed as child fund of Invesco Ltd. and if that institution has disclosed ownership in this security, then these positions will not be double counted when calculating total shares and total value | 182.774 | -13,15 | 3.328 | -14,97 | ||||
| 2026-02-11 | 13F | MCF Advisors LLC | 4.606 | 0,00 | 93 | -13,08 | ||||
| 2025-11-14 | 13F | Voloridge Investment Management, Llc | 0 | -100,00 | 0 | |||||
| 2026-02-17 | 13F | DV Trading LLC | 19 | 0 | ||||||
| 2026-01-12 | 13F | Abound Wealth Management | 12 | 100,00 | 0 | |||||
| 2026-02-09 | 13F | Hantz Financial Services, Inc. | 13.010 | 18,62 | 0 | |||||
| 2026-01-21 | 13F | Step Capital Management Pte. Ltd. | 105.000 | 2.129 | ||||||
| 2026-02-17 | 13F | Boothbay Fund Management, Llc | 23.288 | 42,09 | 472 | 23,24 | ||||
| 2026-01-15 | 13F | Highline Wealth Partners Llc | 251 | 78,01 | 5 | 66,67 | ||||
| 2026-02-17 | 13F | Symmetry Peak Management Llc | Call | 0 | -100,00 | 0 | ||||
| 2026-02-17 | 13F | Cresset Asset Management, LLC | 12.576 | -3,20 | 255 | -16,12 | ||||
| 2026-02-13 | 13F | Wells Fargo & Company/mn | 3.551 | -42,36 | 72 | -50,00 | ||||
| 2026-02-17 | 13F | MIRAE ASSET GLOBAL ETFS HOLDINGS Ltd. | 309.519 | 6,65 | 6.403 | -5,49 | ||||
| 2026-02-11 | 13F | Primecap Management Co/ca/ | 12.801.087 | -7,81 | 259.606 | -20,17 | ||||
| 2026-01-27 | 13F | Belpointe Asset Management LLC | 0 | -100,00 | 0 | |||||
| 2026-02-14 | 13F | Taikang Asset Management (Hong Kong) Co Ltd | 308.737 | 6.261 | ||||||
| 2025-12-16 | 13F | Garde Capital, Inc. | 0 | -100,00 | 0 | -100,00 | ||||
| 2026-02-10 | 13F | Pasadena Private Wealth, LLC | Call | 20.000 | 198 | |||||
| 2026-02-19 | 13F | CI Private Wealth, LLC | 36.051 | 2,79 | 731 | -10,96 | ||||
| 2026-02-12 | 13F | Ci Investments Inc. | 0 | -100,00 | 0 | |||||
| 2026-02-17 | 13F | Equitable Holdings, Inc. | 11.475 | -53,92 | 233 | -60,21 | ||||
| 2026-02-10 | 13F | Bnp Paribas Arbitrage, Sa | 294.564 | -69,25 | 5.974 | -73,37 | ||||
| 2025-11-10 | 13F | New Millennium Group LLC | 0 | -100,00 | 0 | -100,00 | ||||
| 2026-02-11 | 13F | West Family Investments, Inc. | 11.813 | 32,09 | 240 | 14,35 | ||||
| 2026-02-18 | 13F | GWM Advisors LLC | 0 | -100,00 | 0 | |||||
| 2026-01-30 | 13F | TMT General Partner Ltd | 10.285.837 | -59,53 | 208.597 | -29,92 | ||||
| 2026-02-17 | 13F | Weiss Asset Management LP | 0 | -100,00 | 0 | -100,00 | ||||
| 2026-02-17 | 13F | Tower Research Capital LLC (TRC) | 1.207 | -93,78 | 24 | -94,71 | ||||
| 2026-02-11 | 13F | Parallel Advisors, LLC | 10.293 | 6,02 | 209 | -8,37 | ||||
| 2026-02-13 | 13F | Citigroup Inc | 121.177 | -48,61 | 2.457 | -55,51 | ||||
| 2025-11-10 | 13F | Citigroup Inc | Put | 0 | -100,00 | 0 | -100,00 | |||
| 2025-11-13 | 13F | Hsbc Holdings Plc | 68.327 | -70,05 | 1.600 | -60,81 | ||||
| 2026-02-13 | 13F | Toroso Investments, LLC | 72.176 | 59,09 | 1.464 | 37,76 | ||||
| 2026-01-30 | 13F | North Star Investment Management Corp. | 26 | 1 | ||||||
| 2026-02-17 | 13F | Man Group plc | 490.173 | -44,82 | 9.941 | -52,22 | ||||
| 2025-11-05 | 13F | Worm Capital, Llc | 0 | -100,00 | 0 | -100,00 | ||||
| 2026-01-20 | 13F | Nvwm, Llc | 61 | 1 | ||||||
| 2026-02-10 | 13F | Root Financial Partners, LLC | 555 | -44,50 | 11 | -52,17 | ||||
| 2026-01-28 | 13F | DekaBank Deutsche Girozentrale | 1.100.000 | 0,00 | 10 | -65,38 | ||||
| 2026-02-10 | 13F | Savant Capital, LLC | 13.389 | -6,80 | 272 | -19,35 | ||||
| 2026-02-13 | 13F | Primavera Capital Management Ltd | 3.306.567 | 0,00 | 67.057 | -13,41 | ||||
| 2026-02-03 | 13F | Strengthening Families & Communities, LLC | 500 | 10 | ||||||
| 2026-02-10 | 13F | Fideuram Asset Management (Ireland) dac | 91.098 | 1.815 | ||||||
| 2026-02-17 | 13F | Balyasny Asset Management Llc | Put | 174.000 | 26,55 | 3.529 | 9,57 | |||
| 2026-02-17 | 13F | Balyasny Asset Management Llc | 190.073 | 3.855 | ||||||
| 2026-02-17 | 13F | Balyasny Asset Management Llc | Call | 529.000 | 47,19 | 10.728 | 27,46 | |||
| 2026-01-26 | 13F | PFG Investments, LLC | 10.998 | 5,01 | 223 | -8,98 | ||||
| 2025-11-14 | 13F | Public Employees Retirement System Of Ohio | 0 | -100,00 | 0 | -100,00 | ||||
| 2025-11-14 | 13F | Strategic Wealth Partners, Ltd. | 211 | 427,50 | 5 | |||||
| 2026-02-14 | 13F | Rockefeller Capital Management L.P. | 3.125 | 0,00 | 63 | -13,70 | ||||
| 2025-08-27 | NP | CGRO - CoreValues Alpha Greater China Growth ETF | 8.507 | 15,38 | 152 | 0,00 | ||||
| 2026-02-12 | 13F | BlackRock, Inc. | 2.872.090 | 37,27 | 58.246 | 18,86 | ||||
| 2025-09-29 | NP | PBW - Invesco WilderHill Clean Energy ETF This fund is a listed as child fund of Invesco Ltd. and if that institution has disclosed ownership in this security, then these positions will not be double counted when calculating total shares and total value | 231.267 | 36,09 | 4.211 | 33,26 | ||||
| 2026-01-13 | 13F | CoreCap Advisors, LLC | 0 | -100,00 | 0 | |||||
| 2026-02-17 | 13F | Portolan Capital Management, LLC | 96.927 | 1.966 | ||||||
| 2026-02-17 | 13F | Sandler Capital Management | Call | 33.900 | 687 | |||||
| 2025-09-29 | NP | EVAV - Direxion Daily Electric and Autonomous Vehicles Bull 2X Shares | 9.390 | 50,19 | 171 | 46,55 | ||||
| 2026-02-12 | 13F | Advisors Asset Management, Inc. | 59.981 | 4,04 | 1.216 | -9,93 | ||||
| 2026-02-11 | 13F | O'shaughnessy Asset Management, Llc | 41.523 | 10,86 | 842 | -3,99 | ||||
| 2026-01-15 | 13F | Nisa Investment Advisors, Llc | 300 | 0,00 | 6 | -14,29 | ||||
| 2026-01-29 | 13F | China Universal Asset Management Co., Ltd. | 10.000 | 0,00 | 203 | -13,68 | ||||
| 2025-09-29 | NP | POAGX - PRIMECAP Odyssey Aggressive Growth Fund | 3.005.010 | 1,72 | 54.721 | -0,41 | ||||
| 2026-01-23 | 13F | Assetmark, Inc | 346 | 59,45 | 7 | 40,00 | ||||
| 2026-02-11 | 13F | LPL Financial LLC | 123.223 | 46,83 | 2.499 | 27,12 | ||||
| 2026-02-19 | 13F | Atomi Financial Group, Inc. | 22.299 | 14,20 | 452 | -1,09 | ||||
| 2026-02-17 | 13F | Creative Planning | 38.951 | 2,31 | 790 | -11,45 | ||||
| 2026-02-11 | 13F | CNB Bank | 100 | 0,00 | 2 | 0,00 | ||||
| 2026-02-12 | 13F | Capital Markets Trading UK LLP | 90.823 | 229,08 | 2 | |||||
| 2025-11-14 | 13F | Wetherby Asset Management Inc | 69.656 | 2,27 | 1.631 | 34,02 | ||||
| 2026-02-17 | 13F | Ancora Advisors, LLC | 520 | 0,00 | 11 | -16,67 | ||||
| 2026-01-30 | 13F | Yong Rong (HK) Asset Management Ltd | 1.588.000 | 32 | ||||||
| 2025-11-14 | 13F | Cubist Systematic Strategies, LLC | Call | 0 | -100,00 | 0 | ||||
| 2026-02-03 | 13F | Manning & Napier Advisors Llc | 0 | -100,00 | 0 | |||||
| 2026-02-17 | 13F | Bank Of America Corp /de/ | 3.127.757 | -13,52 | 63.431 | -25,12 | ||||
| 2026-01-26 | 13F | KBC Group NV | 32.158 | -11,35 | 1 | |||||
| 2026-02-17 | 13F | Temasek Holdings (Private) Ltd | 1.194.538 | 0,00 | 24.225 | -13,41 | ||||
| 2025-11-12 | 13F | Quantbot Technologies LP | 0 | -100,00 | 0 | |||||
| 2025-09-29 | NP | CCSO - Carbon Collective Climate Solutions U.S. Equity ETF | 33.563 | 0,00 | 611 | -2,08 | ||||
| 2026-02-12 | 13F | CIBC Private Wealth Group, LLC | 2.000 | 0,00 | 41 | -13,04 | ||||
| 2026-02-09 | 13F | AIA Group Ltd | 18.536 | 376 | ||||||
| 2026-02-17 | 13F | Clear Street Markets Llc | 0 | -100,00 | 0 | |||||
| 2026-02-13 | 13F | Aviso Financial Inc. | 0 | -100,00 | 0 | |||||
| 2026-02-13 | 13F | Rafferty Asset Management, LLC | 0 | -100,00 | 0 | |||||
| 2026-02-13 | 13F | State Street Corp | 478.720 | -16,64 | 9.708 | -27,82 | ||||
| 2025-08-28 | NP | Acap Strategic Fund | Short | -1.730.669 | -12,67 | -30.944 | -24,64 | |||
| 2026-01-16 | 13F | Ronald Blue Trust, Inc. | 572 | -5,30 | 12 | -21,43 | ||||
| 2026-02-11 | 13F | Empowered Funds, LLC | 0 | -100,00 | 0 | |||||
| 2026-02-10 | 13F | NINE MASTS CAPITAL Ltd | 0 | -100,00 | 0 | |||||
| 2026-02-17 | 13F | Clough Capital Partners L P | 0 | -100,00 | 0 | |||||
| 2026-02-17 | 13F | Quantitative Investment Management, LLC | 0 | -100,00 | 0 | |||||
| 2026-01-28 | 13F | Financial Perspectives, Inc | 4.399 | 0,00 | 89 | -13,59 | ||||
| 2025-08-27 | NP | BEXFX - Baron Emerging Markets Fund | 400.063 | -39,08 | 7.153 | -47,43 | ||||
| 2026-01-27 | 13F | Evergreen Capital Management Llc | 30.040 | -0,08 | 609 | -13,49 | ||||
| 2026-02-05 | 13F | WIM INVESTMENT MANAGEMENT Ltd | 87.500 | 1.774 | ||||||
| 2026-02-12 | 13F | Brown Brothers Harriman & Co | 201 | 0,00 | 4 | 0,00 | ||||
| 2026-02-13 | 13F | Aigen Investment Management, Lp | 0 | -100,00 | 0 | |||||
| 2026-02-13 | 13F | Hurley Capital, LLC | 0 | 0 | ||||||
| 2026-02-17 | 13F | Parallax Volatility Advisers, L.P. | Put | 100.000 | 2.028 | |||||
| 2026-02-05 | 13F | Allworth Financial LP | 3.032 | 95,99 | 61 | 69,44 | ||||
| 2026-02-17 | 13F | Parallax Volatility Advisers, L.P. | Call | 199.200 | 32,71 | 4.040 | 14,91 | |||
| 2026-02-11 | 13F | Harvest Fund Management Co., Ltd | 88.500 | 0,00 | 1 | 0,00 | ||||
| 2026-02-06 | 13F | Creative Financial Designs Inc /adv | 700 | 0,00 | 14 | -12,50 | ||||
| 2026-02-12 | 13F | Bank of Jackson Hole Trust | 0 | -100,00 | 0 | |||||
| 2026-02-06 | 13F | Leonteq Securities AG | 4.783 | -18,02 | 97 | -29,41 | ||||
| 2026-02-10 | 13F | Nomura Asset Management Co Ltd | 1.790 | 0,00 | 36 | -12,20 | ||||
| 2026-02-17 | 13F | Jones Financial Companies Lllp | 2.638 | 8,16 | 53 | -3,64 | ||||
| 2026-02-13 | 13F | Kestra Advisory Services, LLC | 0 | -100,00 | 0 | |||||
| 2026-01-27 | 13F | Fortis Capital Advisors, LLC | 0 | -100,00 | 0 | |||||
| 2025-09-26 | NP | UUPIX - Ultraemerging Markets Profund Investor Class | 3.222 | 18,72 | 59 | 16,00 | ||||
| 2026-02-13 | 13F | Wells Fargo & Company/mn | Put | 0 | -100,00 | 0 | -100,00 | |||
| 2026-02-12 | 13F | Jane Street Group, Llc | Put | 2.573.400 | 120,08 | 52.189 | 90,57 | |||
| 2026-02-12 | 13F | Jane Street Group, Llc | Call | 2.339.900 | 7,09 | 47.453 | -7,26 | |||
| 2026-02-09 | 13F | Coldstream Capital Management Inc | 10.238 | -68,74 | 208 | -73,01 | ||||
| 2026-02-17 | 13F | Citadel Advisors Llc | Call | 2.177.300 | 49,50 | 44.156 | 29,46 | |||
| 2025-11-12 | 13F | Fox Run Management, L.l.c. | 0 | -100,00 | 0 | |||||
| 2026-02-17 | 13F | Citadel Advisors Llc | Put | 1.866.700 | -7,39 | 37.857 | -19,81 | |||
| 2026-02-17 | 13F | Citadel Advisors Llc | 1.210.966 | -1,04 | 24.558 | -14,31 | ||||
| 2025-08-26 | NP | Profunds - Profund Vp Asia 30 | 33.011 | -7,23 | 590 | -19,95 | ||||
| 2026-02-10 | 13F | Bnp Paribas | 16.350 | 10,85 | 332 | -4,06 | ||||
| 2025-11-07 | 13F | Sierra Ocean, Llc | 0 | -100,00 | 0 | |||||
| 2026-01-27 | 13F | Bayforest Capital Ltd | 0 | -100,00 | 0 | |||||
| 2025-08-25 | NP | CARZ - First Trust NASDAQ Global Auto Index Fund This fund is a listed as child fund of First Trust Advisors Lp and if that institution has disclosed ownership in this security, then these positions will not be double counted when calculating total shares and total value | 6.807 | -49,55 | 122 | -56,63 | ||||
| 2026-02-13 | 13F | Squarepoint Ops LLC | Call | 144.800 | -50,77 | 2.937 | -57,37 | |||
| 2026-02-13 | 13F | Squarepoint Ops LLC | Put | 33.700 | -43,07 | 683 | -50,72 | |||
| 2026-02-13 | 13F | Squarepoint Ops LLC | 46.347 | 940 | ||||||
| 2026-02-13 | 13F | Verition Fund Management LLC | 0 | -100,00 | 0 | -100,00 | ||||
| 2026-02-12 | 13F | Bank Of Montreal /can/ | 117.491 | 80,49 | 2.383 | 56,30 | ||||
| 2026-02-13 | 13F | Flow Traders U.s. Llc | 0 | -100,00 | 0 | |||||
| 2026-02-17 | 13F | PharVision Advisers, LLC | 0 | -100,00 | 0 | |||||
| 2026-02-11 | 13F | Cerity Partners LLC | 17.760 | 360 | ||||||
| 2026-02-13 | 13F | Smartleaf Asset Management LLC | 1.219 | 26 | ||||||
| 2026-02-10 | 13F | Goldman Sachs Group Inc | Call | 250.000 | 5.070 | |||||
| 2026-02-10 | 13F | Goldman Sachs Group Inc | 3.275.956 | -8,00 | 66.436 | -20,34 | ||||
| 2026-02-13 | 13F | Atlas Capital Advisors Llc | 200 | 0,00 | 4 | 33,33 | ||||
| 2026-02-13 | 13F | Marshall Wace, Llp | Put | 0 | -100,00 | 0 | ||||
| 2025-11-17 | 13F | Hancock Prospecting Pty Ltd | 0 | -100,00 | 0 | -100,00 | ||||
| 2026-02-11 | 13F | Gordian Capital Singapore Pte Ltd | 15.000 | 2 | ||||||
| 2026-02-13 | 13F | Marshall Wace, Llp | Call | 0 | -100,00 | 0 | ||||
| 2026-02-13 | 13F | Marshall Wace, Llp | 0 | -100,00 | 0 | |||||
| 2026-02-13 | 13F | Intercapital, Llc | 25.000 | 507 | ||||||
| 2026-02-17 | 13F | Prelude Capital Management, Llc | 14.000 | -13,85 | 284 | -25,53 | ||||
| 2026-02-17 | 13F | Northern Trust Corp | 170.601 | 0,26 | 3.460 | -13,18 | ||||
| 2026-02-05 | 13F | DnB Asset Management AS | 114.648 | 2.325 | ||||||
| 2025-08-27 | NP | CGAEX - Calvert Global Energy Solutions Fund Class A | 35.862 | 0,46 | 641 | -13,26 | ||||
| 2026-01-14 | 13F | Yarbrough Capital, LLC | 278.642 | 269,81 | 5.651 | 220,29 | ||||
| 2026-01-29 | 13F | Kickstand Ventures, Llc. | 9.952 | 202 | ||||||
| 2025-09-26 | NP | UGPIX - UltraChina ProFund Investor Class | 39.216 | 35,44 | 714 | 32,71 | ||||
| 2026-02-17 | 13F | D. E. Shaw & Co., Inc. | Call | 1.342.300 | 63,38 | 27.222 | 41,47 | |||
| 2026-02-17 | 13F | D. E. Shaw & Co., Inc. | 156.778 | -90,37 | 3.179 | -91,67 | ||||
| 2026-02-17 | 13F | D. E. Shaw & Co., Inc. | Put | 337.600 | 6.847 | |||||
| 2026-02-17 | 13F | Optiver Holding B.V. | 31 | 1 | ||||||
| 2026-01-23 | 13F | TT International Asset Management LTD | 685.959 | 14 | ||||||
| 2026-02-12 | 13F | Barometer Capital Management Inc. | 0 | -100,00 | 0 | |||||
| 2026-02-17 | 13F | Scarborough Advisors, LLC | 46 | 0,00 | 1 | -100,00 | ||||
| 2025-11-07 | 13F | Gsa Capital Partners Llp | 0 | -100,00 | 0 | |||||
| 2026-02-04 | 13F | Abc Arbitrage Sa | 0 | -100,00 | 0 | |||||
| 2026-02-12 | 13F | Skopos Labs, Inc. | 18.618 | 22,32 | 382 | 7,02 | ||||
| 2026-02-13 | 13F | Peak6 Llc | Put | 778.200 | 3,62 | 15.782 | -10,27 | |||
| 2026-01-22 | 13F | HHM Wealth Advisors, LLC | 0 | -100,00 | 0 | |||||
| 2026-02-13 | 13F | Peak6 Llc | 35.876 | 728 | ||||||
| 2026-02-13 | 13F | Peak6 Llc | Call | 2.343.700 | 32,07 | 47.530 | 14,36 | |||
| 2026-02-12 | 13F | Federation des caisses Desjardins du Quebec | 26.528 | -13,70 | 538 | -25,31 | ||||
| 2026-02-03 | 13F | Crossmark Global Holdings, Inc. | 14.504 | -0,48 | 294 | -13,78 | ||||
| 2026-01-21 | 13F | MBL Wealth, LLC | 10.284 | 0,00 | 209 | -13,33 | ||||
| 2026-02-03 | 13F | Robeco Schweiz AG | 666.000 | 13.506 | ||||||
| 2026-02-09 | 13F | Accent Capital Management, LLC | 330 | 10,00 | 7 | -14,29 | ||||
| 2026-02-13 | 13F | Parkside Financial Bank & Trust | 58 | 0,00 | 1 | 0,00 | ||||
| 2026-02-13 | 13F | Ieq Capital, Llc | 10.056 | -13,28 | 204 | -25,09 | ||||
| 2026-02-12 | 13F | Hrt Financial Lp | 0 | -100,00 | 0 | |||||
| 2025-08-27 | NP | CEFIX - Calvert Emerging Markets Advancement Fund Class I | 12.493 | 0,00 | 223 | -13,57 | ||||
| 2025-08-26 | NP | Profunds - Profund Vp Emerging Markets | 11.275 | 11,39 | 202 | -3,83 | ||||
| 2026-01-14 | 13F | Jfs Wealth Advisors, Llc | 623 | 0,00 | 13 | -14,29 | ||||
| 2026-02-10 | 13F | Pasadena Private Wealth, LLC | 10.365 | 210 | ||||||
| 2026-02-17 | 13F | KADENSA CAPITAL Ltd | 0 | -100,00 | 0 | |||||
| 2026-02-12 | 13F | Dimensional Fund Advisors Lp | 11.202 | -6,69 | 227 | -19,22 | ||||
| 2026-02-11 | 13F | Jpmorgan Chase & Co | 719.121 | 11.491,25 | 14.584 | 9.957,24 | ||||
| 2026-01-29 | 13F | UMA Financial Services, Inc. | 0 | -100,00 | 0 | |||||
| 2025-11-04 | 13F | Twenty Acre Capital LP | 0 | -100,00 | 0 | -100,00 | ||||
| 2025-08-28 | NP | KOMP - SPDR S&P Kensho New Economies Composite ETF This fund is a listed as child fund of State Street Corp and if that institution has disclosed ownership in this security, then these positions will not be double counted when calculating total shares and total value | 351.743 | 64,85 | 6.289 | 42,25 | ||||
| 2026-01-30 | 13F | Us Bancorp \de\ | 68.987 | -5,80 | 1.399 | -18,43 | ||||
| 2026-01-29 | 13F | IMC-Chicago, LLC | 809.987 | 36,80 | 16.427 | 18,46 | ||||
| 2026-02-17 | 13F | SageView Advisory Group, LLC | 266 | 5 | ||||||
| 2026-02-17 | 13F | Quantinno Capital Management LP | 105.210 | 13,46 | 2.134 | -1,75 | ||||
| 2026-02-06 | 13F | Banque Cantonale Vaudoise | 2.763 | 56 | ||||||
| 2026-02-13 | 13F | Mariner, LLC | 64.798 | -4,37 | 1.316 | -17,02 |